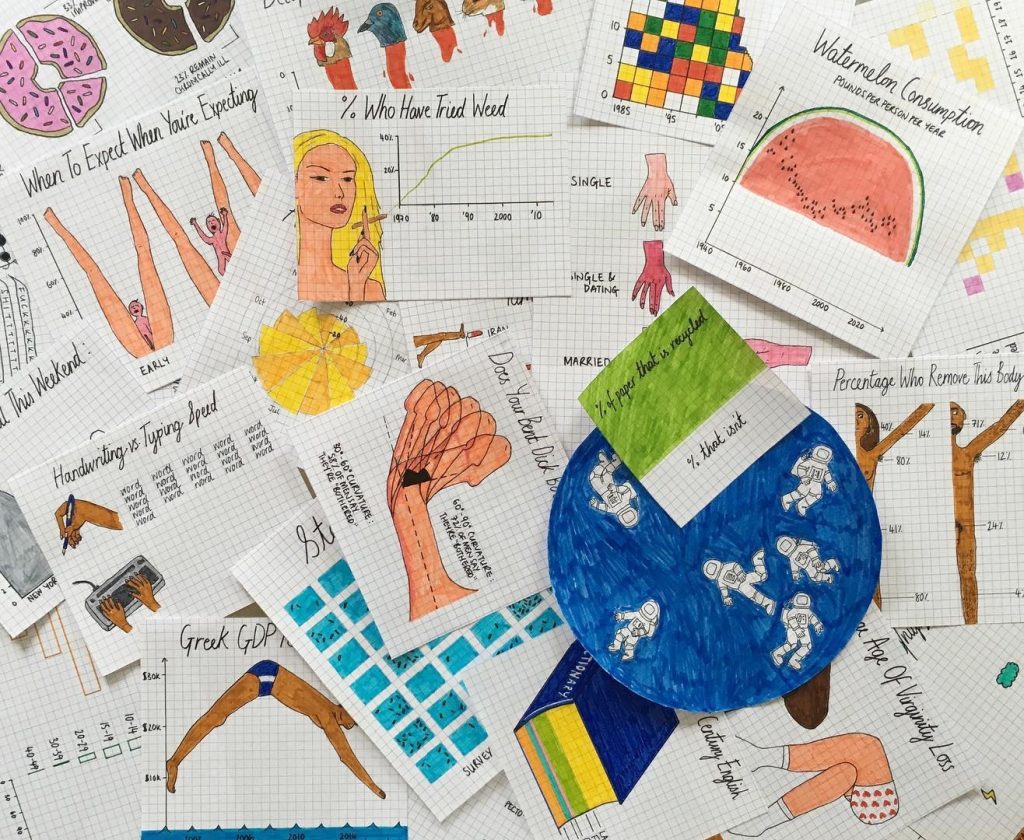
(courtesy Mona Chalabi)
For a sense of Mona Chalabi’s work with data, you could do an author search at her employer’s site, The Guardian, where she’s the data editor. But if you wanted some really fascinating, raw insights, you could go to her Instagram page. There you’ll find handwritten, hand-colored charts, graphs and various other depictions showing such things as American nose jobs by year (which “beaked” at nearly 4 million in 2000); keyboard usage by key (“e” is the English champ); when Americans eat pizza (snacking is the surprising winner); and the top languages by (scarily depicted) native tongues. Chalabi’s interests are far-ranging, and include lots of borderline NSFW data nuggets, too (ideal penis size, farting frequency, orgasm rates and more). While her data sources are digital, her preferred tools are overtly analog: graph paper and colored markers. [more]